import numpy
import matplotlib.pyplot as pltMatplotlib
Matplotlib can be used for creating plots and charts. The library is generally used as follows: Call a plotting function with some data (e.g. .plot()). Call many functions to setup the properties of the plot (e.g. labels and colors). Make the plot visible (e.g. .show()).
Line Plot
myarray = numpy.array([1,2,3])plt.plot(myarray)
plt.xlabel('X axis')
plt.ylabel('Y axis')
plt.show()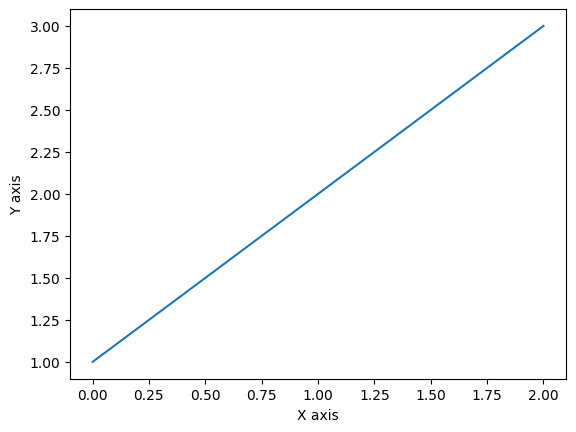
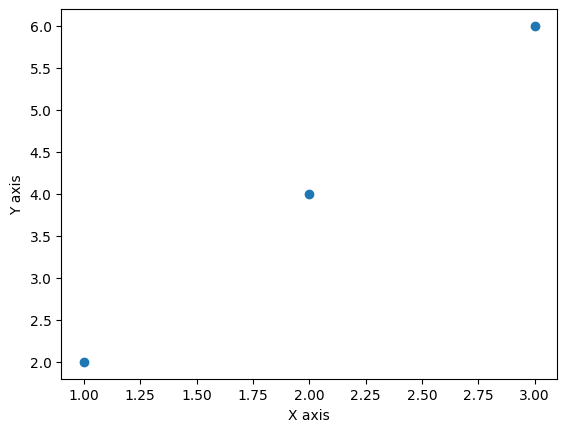
Scatter Plot
x = numpy.array([1,2,3])
y = numpy.array([2,4,6])
plt.scatter(x,y)
plt.xlabel('X axis')
plt.ylabel('Y axis')
plt.show()